
Part 7 — What Consumers Actually Pay: The Retail Story
From State Monopoly to Smart Grid: The Evolution of Energy Prices in Western Australia

This article details the evolution of electricity prices in Western Australia, with a focus on household consumers. In their efforts to reduce their electricity bills, Western Australians adopted home-sized solar power systems. Ultimately, this will prove self-defeating as they will ultimately be required to pay for the additional system cost incurred. A few small changes, however, would have avoided most of the additional cost.
The story of the WEM, told in Part 1 through Part 6, is at its core, about wholesale electricity — the price generators receive and the market mechanisms that determine it. But for most Western Australians, the wholesale market is invisible. What they experience is a bill, a tariff rate, and increasingly, a choice about whether to install solar panels and batteries. This section examines how the wholesale story translated — and frequently did not — into what consumers in each market segment actually paid.
The Two-Tier Retail Market
Western Australia operates a divided retail market. A regulated tariff applies to residential households and small businesses consuming less than 50 megawatt-hours (MWh) per year. These customers are served by the state-owned retailer, Synergy, on rates set by the WA State Government. Above the 50 MWh threshold, customers are contestable — they can negotiate directly with competing retailers or enter bilateral contracts with generators. Large industrial consumers, including mining operations, alumina refineries, and petrochemical facilities, operate almost entirely in the contestable segment. This division means that the wholesale market’s price signals reach different consumers with very different intensities and lag times.
The Residential Experience: Protected, Subsidised, and Restructured
For the majority of Western Australian households — those served on Synergy’s standard A1 residential tariff — the direct experience of energy prices has been shaped more by government policy than by market dynamics. Throughout the first decade of the WEM (2006–2016), regulated tariffs were held at levels the Economic Regulation Authority (ERA) consistently found to be below the efficient cost of supply. The gap between what households paid and what it cost to supply them was absorbed partly by Synergy’s balance sheet — underwritten by the government, as the sole shareholder, through equity injections and below-market dividend expectations — and partly through direct government payments to compensate for Synergy’s below-cost trading position.
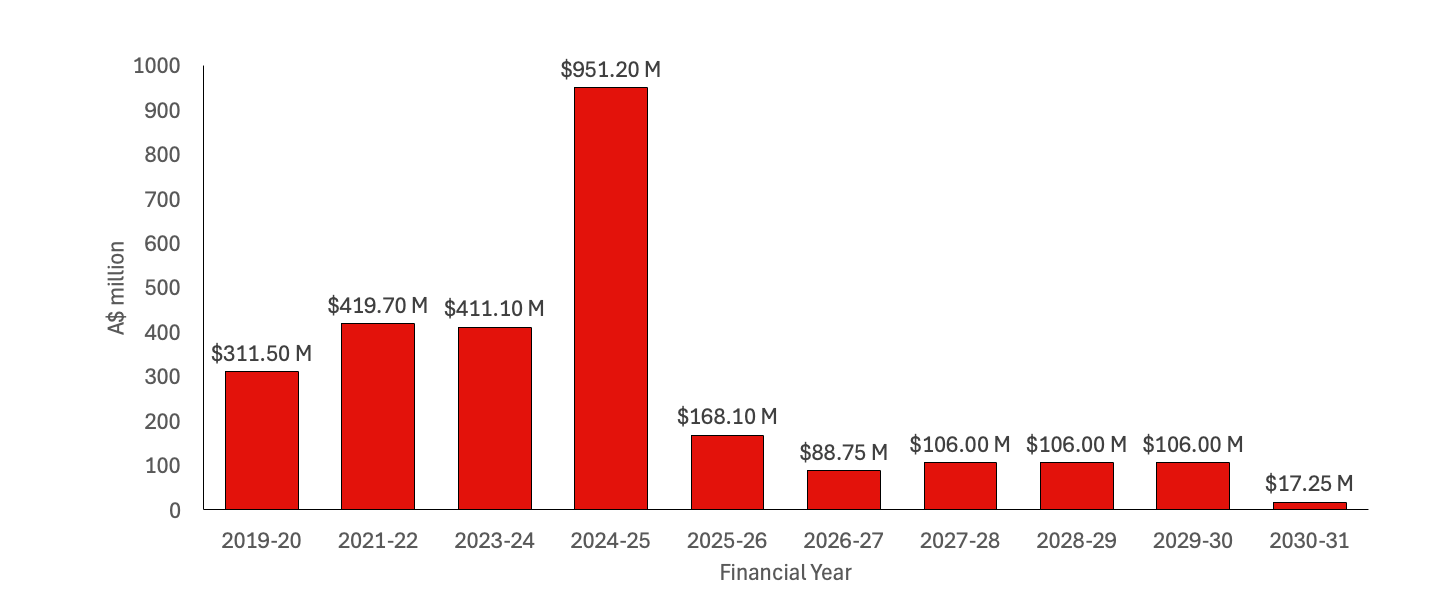
Source: State Government budget papers
The ERA’s 2013 inquiry quantified this support as a Community Service Obligation in its formal analysis, estimating the annual cost at approximately $350 million for 2011/12.

Source: Synergy annual reports
The tariff data now available for the period from 2016/17 to 2024/25 anchors the consumer experience in concrete numbers. A typical Perth household consuming 7,000 kilowatt-hours (kWh) per year faced a total annual bill of approximately $2,031 in 2016/17. By 2024/25 that same household’s bill had risen to approximately $2,690 — an increase of $659, or 32.5%, over eight years. At roughly 4% per year in nominal terms, this is a modest increase by the standards of East Coast jurisdictions, which experienced much sharper electricity price growth over the same period, particularly following the eastern LNG export buildout. What this comparison obscures, however, is that the WA tariff in 2016/17 was itself already subsidised, so the starting point for the comparison was already below cost.
The most structurally significant event in the history of residential tariffs occurred in the bill's structure. In 2018/19, the government implemented a tariff restructuring that more than doubled the daily supply charge — from 48.60 cents per day to 101.55 cents per day, a 109% increase — while holding the unit rate increase to a modest 7%. This restructuring shifted a material share of the electricity bill from a variable charge (which scales with consumption) to a fixed charge (which does not). The ERA had recommended movement in this direction for years, on the grounds that network costs — the largest single cost component in the electricity supply chain — are largely fixed and independent of how much electricity a given household actually uses. By charging a higher fixed amount, the tariff structure more accurately reflected the underlying cost causality.
The distributional consequences, however, were asymmetric. High-consumption households — those using more than around 19 kWh per day — saw their effective average unit cost fall, because a greater share of their bill was now in the fixed component. Low-consumption households — pensioners living alone, renters, small-apartment households, and those already conserving to reduce bills — were worse off. The fixed supply charge doubled regardless of how little electricity they used. Solar households occupied a third position: rooftop solar reduces usage charges (the variable component) but cannot reduce the fixed daily supply charge. The restructuring, therefore, reduced the bill-reduction benefit of going solar, all else equal — a dynamic that remains relevant as solar penetration continues to grow and the network cost base expands.
Since 2018/19, unit rate increases have been moderate, averaging approximately 1.4 cents per kWh per year — broadly tracking general CPI. The 2023/24 increase of 1.52 cents per kWh (+5.1%) was an exception: the largest single-year unit rate increase in the available tariff series, coinciding with the first full year of the new WEM’s Security-Constrained Economic Dispatch (SCED) regime and the resulting elevation in wholesale energy prices. The 2024/25 increase returned to a moderate 0.79 cents (+2.5%). Whether the 2023/24 spike represents a one-off adjustment or the beginning of a structurally higher tariff trajectory remains an open question for the period ahead.
As of 2026/27, the State Government has approved a 2.75% increase to the standard residential tariff and has committed $355 million over four years through a dedicated Cost Growth Assistance Payment to cover the cost of below-cost supply. Cost recovery on the A1 residential tariff has fallen from approximately 78 cents in the dollar to approximately 75 cents — meaning the State Budget continues to subsidise roughly one quarter of every household’s electricity bill, even as the wholesale market has moved to more cost-reflective pricing.
The Solar Household — Private Savings, System Costs, and a Missing Price Signal
The rapid uptake of rooftop solar across the SWIS from 2010 onward delivered genuine private financial benefit to households that installed panels. It did not, in any straightforward sense, reduce the cost of operating the electricity system. Understanding why requires separating what rooftop solar changed from what it left unchanged — and what it made structurally worse.
What solar changed: the household bill
A typical Perth household installing a north-facing 3-kilowatt solar system could reduce its grid consumption by up to 35%. Under a volumetric tariff — where the unit rate accounts for nearly 90% of the average household bill — that consumption reduction translates directly into a lower bill. This is the financial logic that drove uptake: households facing rising tariffs adopted a technology that reduced their exposure to those tariffs. The premium feed-in tariff (40–60 cents per kWh, available from 2010 to August 2011) further amplified returns, offering export revenues well above the wholesale value of that electricity and sharply shortening payback periods. The Commonwealth’s Small-scale Technology Certificate (STC) subsidy reduced upfront capital costs at the point of installation, accelerating penetration across a wider range of income segments than would otherwise have adopted.
What solar did not change: the evening peak
The system-wide electricity demand peak on the SWIS occurs in the late afternoon and early evening — driven by air-conditioning load, cooking, and the return of households from work. This is precisely the period when rooftop solar output is falling toward zero. A household that reduces its midday grid consumption by 35% through solar may reduce its contribution to the system peak by little or nothing. Grattan Institute analysis of Western Power customer-level data found that solar households used, on average, 20% to 25% less electricity overall — but their maximum demand during system-wide peak periods was not significantly different from that of non-solar households facing the same peak conditions. The network is sized to meet that peak. The capital cost of building and maintaining the network is driven by that peak. Under the volumetric tariff structure that prevailed throughout this period, a solar household that reduced its annual consumption by a third paid proportionally less toward the network — even though its demand on the network at the moments that actually drive infrastructure cost was essentially unchanged.
This is the mechanism through which solar adoption transferred costs rather than reduced them. As Grattan (2015) documented, households with solar PV reduced their contribution to network charges by approximately $200 per year on average, while reducing the actual costs they imposed on the network by only around $80. The $120 gap was recovered from other consumers. With solar penetration in the SWIS reaching among the highest levels in the world by the mid-2010s, this transfer became systemic. Non-solar households — disproportionately renters, lower-income households, and those in older housing stock lacking suitable roof orientation — bore a growing share of fixed network costs as solar households increasingly avoided them through reduced volumetric bills.
What solar made structurally harder: system minimum management
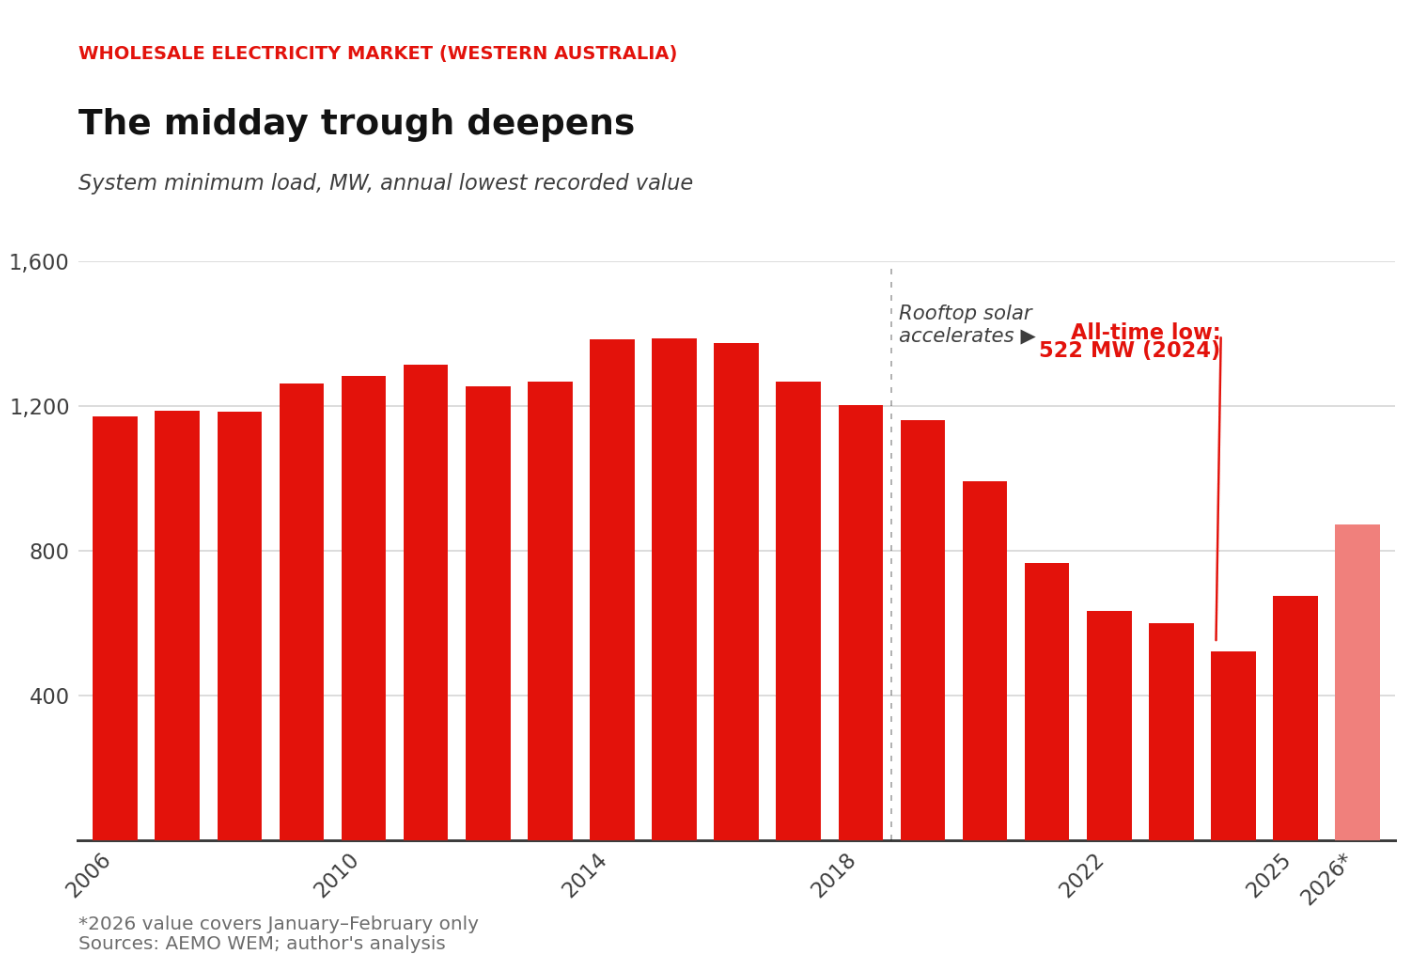
Widespread solar generation introduced a new operational problem that did not exist under a predominantly thermal system. At midday on sunny days, solar output across the SWIS could depress grid demand to very low levels — sometimes approaching or below the minimum stable output of the coal-fired generators that still needed to be online for frequency stability and evening peak readiness. Managing these system minimum conditions imposed real costs: thermal plant could not be shut down and restarted within the hours available between a solar midday minimum and an evening peak, so operators held generation online at low output levels. Coal generators operating at part-load run less efficiently — coal consumption per unit of electricity output rises as a generator turns down from its design operating point. This partially offset the fuel cost savings that solar generation displaced during the midday period. The net effect on operating costs was therefore more complicated than simple displacement arithmetic would suggest; some of the savings from reduced coal burn at full load were consumed by the inefficiency penalty of operating remaining plant at reduced output.
What remained entirely absent: a demand price signal
Throughout this period, WA’s residential tariff structure contained no demand component — no charge based on a household’s maximum power draw at any point in time. Grattan (2015) identified this as the central structural flaw in the tariff architecture. Network costs are driven overwhelmingly by peak demand: the network must be sized to accommodate the highest load it will ever be asked to carry, and that sizing requirement drives capital expenditure regardless of how many kilowatt-hours are consumed across the year. A tariff based on annual kilowatt-hour consumption gives households a financial incentive to reduce their total energy use — but no incentive to shift the timing of that use away from peak periods.
The practical consequence is that the reserve capacity requirement on the SWIS cannot be reduced by improvements in volumetric efficiency alone. A household that installs solar panels, reduces its annual consumption by 30%, and exports at midday has done nothing to reduce the network’s peak capacity obligation. The system must still hold firm capacity — dispatchable generation, reserve margin, transmission and distribution infrastructure — sufficient to meet the evening peak for every household connected to the network, solar or not. As solar penetration grew, the ratio of installed system capacity to annual energy consumed moved in an unfavourable direction: more infrastructure cost, spread across fewer kilowatt-hours of billed consumption.
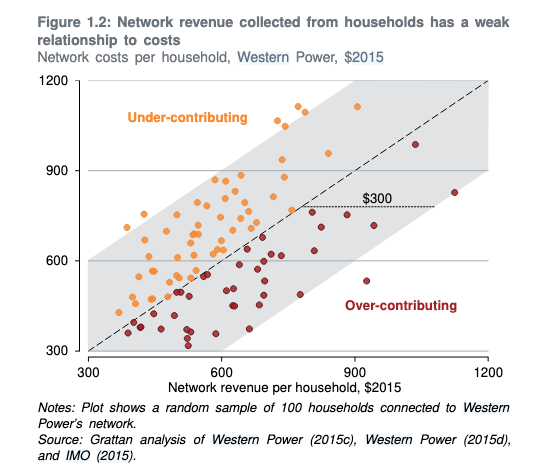
Source: Wood, Tony, and David Blowers. Fair Pricing for Western Australia’s Electricity. Policy Analysis. Grattan Institute, 2015. https://grattan.edu.au/wp-content/uploads/2015/11/831-Fair-pricing-for-Western-Australia-electricity.pdf.
The 2018/19 tariff restructuring — which more than doubled the fixed daily supply charge — was, in part, a belated acknowledgment of this problem. By shifting more cost recovery into the fixed component, the government moved in the direction that the ERA had been recommending for years: charging for network availability rather than purely for consumption. But a fixed daily supply charge is a blunt instrument. It does not vary with a household’s peak demand. It treats the household that draws 10 kilowatts on a summer evening the same way as the household that draws 2 kilowatts. A demand tariff — structured around each household’s maximum demand during peak windows, as Grattan (2015) recommended — would have provided a materially stronger signal to households to shift their high-consumption activities away from peak periods, or to invest in battery storage to reduce their grid draw at peak times. The WA tariff reform debate had identified this instrument by 2015. Its implementation in the residential market remained incomplete a decade later.
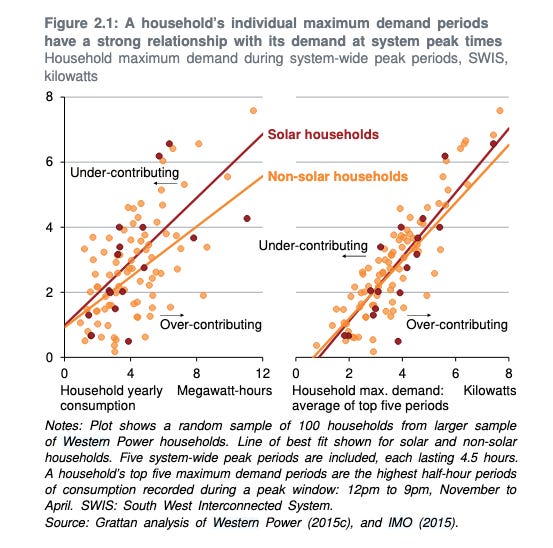
Source: Wood, Tony, and David Blowers. Fair Pricing for Western Australia’s Electricity. Policy Analysis. Grattan Institute, 2015. https://grattan.edu.au/wp-content/uploads/2015/11/831-Fair-pricing-for-Western-Australia-electricity.pdf.
The current export reward structure — the Distributed Energy Buy-back Scheme (DEBS) — offers time-of-day-varying rates: approximately 10 cents per kWh for evening exports and approximately 2 to 3 cents per kWh for daytime exports. This structure reflects a genuine market signal: daytime solar output has become abundant on the SWIS to the degree that its grid value at midday is low or even negative, while evening exports retain material value. The DEBS structure thus rewards the behaviour the grid needs — storing solar output and exporting it later — while giving a weaker signal to households that simply export at midday and draw from the grid in the evening.
The solar story is therefore one of rational individual responses to a price structure that socialises costs. Each household that installed solar under the premium feed-in tariff and volumetric billing regime made a financially sensible decision given the rules in place. Collectively, those decisions shifted costs to non-solar households, degraded the economic case for thermal baseload operation without removing the operational need for it, and left the underlying peak-demand problem unaddressed. A demand-reflective tariff, implemented alongside the solar rollout, could, in principle, have preserved private savings from solar while better aligning household incentives with system costs. The absence of that instrument is one of the more consequential design gaps in the WA electricity pricing architecture of the 2010s.
The Commercial and Industrial Consumer: Market-Exposed and Incentivised
Contestable customers — those consuming more than 50 MWh per year — have experienced WEM’s wholesale price signals directly throughout the market’s existence. For large industrial users, electricity prices are an input cost that appears directly in their operational economics. This creates a qualitatively different relationship with energy pricing than that experienced by residential households insulated behind regulated tariffs.
During the WEM’s first decade, contestable customers benefited from the same gas-cost advantages that suppressed Synergy’s supply costs — bilateral contracts with Verve Energy (later Synergy’s generation arm) were typically priced off the domestic gas market, which was itself insulated from international LNG price pressures by a combination of the 15% reservation policy, continuing coal competition, and long-established contract structures. As the east coast LNG buildout pushed eastern Australian gas prices toward export parity after 2014, WA’s large industrial consumers retained a structural cost advantage that their eastern states’ competitors did not.
The new WEM and its elevated Reserve Capacity Prices have altered this calculus. Large electricity users that had previously purchased capacity implicitly through their bilateral contracts are now exposed to capacity cost signals that are set by the Reserve Capacity Mechanism (RCM). For energy-intensive facilities whose business case assumed a particular electricity cost trajectory, the post-2023 environment — with wholesale energy prices above historical norms and capacity costs rising toward $360,700 per MW for the 2027-28 capacity year — represents a material change in the investment backdrop. The commercial response, where facilities and capital are available, has been to invest in behind-the-meter generation: on-site solar, gas cogeneration, and battery storage that reduce grid offtake and, with it, exposure to rising market prices. Several large WA industrial sites have pursued or announced hybrid renewable energy investments that would have been economically marginal a decade ago.
The Regional Consumer: Uniform Price, Non-Uniform Cost
Western Australia’s Uniform Tariff Policy guarantees that consumers in regional and remote areas served by Horizon Power — the state-owned network operating outside the SWIS — pay the same regulated tariffs as consumers in the metropolitan SWIS area. The policy has been in place since well before the WEM’s establishment and reflects a political and social commitment to geographic equity in electricity access.
The fiscal cost of this commitment is substantial. The Tariff Equalisation Contribution (TEC), paid by commercial customers in the SWIS network, funds the gap between the actual higher cost of remote supply and the uniform tariff. In 2026/27, this contribution amounts to approximately $290 million — a figure that underscores the engineering reality that supplying electricity to dispersed remote communities is fundamentally more expensive per unit than supplying dense urban networks. Remote systems cannot access the economies of scale available on the SWIS, have lower demand diversity, and face higher per-kilometre infrastructure costs. The uniform tariff policy socialises these costs across the SWIS commercial sector rather than leaving them to be borne by remote households, who are already facing a higher underlying cost of living in regional WA.
Grattan (2015) documented that the cross-subsidy structure embedded in the Uniform Tariff Policy is, in practice, poorly targeted. Under a volumetric tariff, households that consume more electricity receive a proportionally higher subsidy in dollar terms — but in both the SWIS and Horizon Power areas, higher-consuming households tend not to be the most economically vulnerable. In Horizon Power’s North West Interconnected System, households not classified as vulnerable consumed approximately 50% more electricity than those that were, meaning the existing subsidy structure delivered more value to less vulnerable consumers. Reforming this structure — through demand-reflective tariffs, better-targeted rebates, and direct government funding of Horizon Power rather than cross-subsidy through the TEC — has been identified as a priority by successive reviews, but the political complexity of regional tariff reform has meant progress has been slow.
The Low-Income Consumer: Layered Concessions, Residual Vulnerability
Low-income and hardship consumers in WA access electricity through the same regulated Synergy tariff as all other residential customers — meaning the base tariff already embeds an implicit subsidy, as it is set below cost. On top of this structural subsidy, WA operates ongoing state-based rebate and concession schemes for eligible households, including pensioners, holders of various Health Care and Concession Cards, and households in identified hardship situations. The precise scale of these concessions — in terms of dollar value per recipient and total annual program cost represents a targeted layer of relief delivered through Synergy billing on top of the universal below-cost tariff.
From 2023/24, the Commonwealth’s Energy Bill Relief Fund added a further layer: $300 per eligible household per year (paid in quarterly instalments), expanded to $3.5 billion nationally in 2024/25 and continuing into 2025/26. For a low-income household spending $2,000 to $2,700 per year on electricity, a $300 rebate represents a reduction of roughly 11% to 15% — meaningful but not transformative. The rebate structure also carries an important limitation: it is temporary and subject to budget renewal, whereas the underlying structural cost trends — network investment, the energy transition, rising wholesale prices — are structural and ongoing.
The tariff restructuring of 2018/19 introduced a further inequity for low-income households. The doubling of the fixed daily supply charge was borne equally by all households, regardless of consumption. This means that the lowest-consuming households (who are disproportionately low-income, elderly, or renting) faced the sharpest proportional increase relative to their total bill. A pensioner using 3,000 kWh per year saw the fixed component of their annual bill increase by approximately $193, which is a much larger proportional hit than experienced by a high-consuming family on the same tariff. This regressive characteristic of fixed-charge tariff structures is a recognised policy tension in electricity pricing reform, and WA’s 2018/19 restructuring did not include a compensating concession adjustment for the lowest-consumption households.
The Gas Consumer: Three Mechanisms, Not One Policy
The gas price story is frequently summarised as a success story in reservation policy. That framing is only partially correct. The observed divergence between Perth gas prices and the east coast — and between WA and international LNG benchmarks — is the product of at least three distinct mechanisms operating simultaneously. Attributing the outcome to any single instrument overstates what is actually known.
The ABS CPI data show that Perth retail gas prices grew by approximately 161% from September 2006 to December 2025, while the national weighted average grew by approximately 203% over the same period. On the face of it, WA consumers did better than the national average. But the question worth asking is: how much of that divergence was due to policy, and how much to structure?
Mechanism 1: The Domestic Gas Reservation Policy — a supply guarantee, not a price guarantee
The WA Domestic Gas Reservation Policy, announced in September 2006 and legally operative from 2011, requires each new LNG export project to reserve 15% of its gas for the domestic market. The policy’s effect is frequently described as keeping WA gas prices low. That characterisation requires an important qualification: the reservation policy guarantees availability, not price or delivery schedule. What it prevents is a wholesale withdrawal of domestic gas supply into LNG export markets of the kind that tightened the East Coast after 2014. Ensuring a minimum domestic supply obligation prevents the most acute form of export-parity pricing, where domestic buyers must compete with Asian LNG importers for every molecule.
The East Coast comparison is instructive. After the Queensland LNG export terminals reached full capacity from around 2014 to 2016, eastern Australian domestic gas prices were pulled sharply toward export parity. WA did not experience the same shock. The divergence in the CPI series from approximately 2012–2014 onward is consistent with the reservation policy providing insulation against that specific mechanism. But it is also consistent with — and almost certainly co-determined by — the other two mechanisms described below.
Mechanism 2: Competition from coal and the historical legacy of coal-linked pricing
Throughout the WEM’s first decade, WA gas did not price against an unconstrained domestic market. It is priced against coal. Muja and Collie power stations — operating on Collie basin coal — were the system’s dominant baseload generators and set an effective price ceiling for gas in the electricity market: gas generators could only command a premium over coal-fired generation sufficient to offset gas’s operating efficiency advantage. This is not a new dynamic. The NWS–SECWA take-or-pay contracts signed in 1980 explicitly used coal-competitive pricing formulas to set the upstream gas price, which, according to contemporary sources, held upstream prices at approximately AUD $2–3 per gigajoule throughout the contract period to 2005. Coal was the pricing benchmark.
This competitive dynamic persisted well into the WEM era. As long as Muja and Collie remained substantial generators on the SWIS, they constrained the price that gas generators could charge without losing dispatch. When the coal fleet began to exit — Collie Power Station scheduled for retirement in 2027, Muja D in 2029, Bluewaters unavailable from October 2028 — this competitive ceiling weakened. The observed acceleration in gas-related costs in the post-2023 period is at least partly consistent with the removal of this competitive discipline, independent of any change in reservation policy settings.
Mechanism 3: The competitive entry of wind and solar
From around 2015 onward, and accelerating sharply through the early 2020s, renewable energy entered the SWIS at scale. For large industrial consumers in particular — mining operations, alumina refineries, minerals processing facilities — this created a meaningful competitive alternative to gas-fired supply for a growing proportion of their energy needs. An industrial customer that can source 40% of its annual energy demand from a contracted wind or solar project at a fixed tariff has a reduced negotiating position vis-à-vis its gas supplier, but its total energy cost exposure to gas price movements is also materially reduced.
More directly, the expansion of renewable generation on the SWIS changed the dispatch stack. As solar displaced midday gas-fired generation, gas plants ran fewer hours per year. A generator running 3,000 hours per year can justify a long-term take-or-pay gas supply contract with a capacity reservation component. A generator running 1,500 hours because solar has taken the midday market faces a less attractive contracting calculus. This shift from baseload gas to peaking gas changes the structure of gas demand, and a market in which gas is increasingly a peaking fuel, competing with batteries for short-duration response, is a different competitive environment from one in which gas runs continuously as the marginal energy source.
Evaluating the three mechanisms
These three mechanisms operated concurrently and reinforced one another across different sub-periods. The reservation policy was most material during the 2014–2016 window, when East Coast export-parity pressures were at their most acute. Coal competition was the dominant price-setting mechanism for gas in the SWIS from the system’s origin through to at least the mid-2010s, and its gradual withdrawal is now changing the competitive environment. Renewable competition has become the new structural constraint on gas pricing for the industrial and large commercial segments since approximately 2018–2020.
The CPI data alone cannot decompose the relative contributions of these three mechanisms. Perth gas CPI diverged from the national average. Whether the reservation policy, coal competition, or renewable entry was the primary driver of that divergence in any given sub-period is an empirical question that requires supply-and-demand modelling at a level of granularity not yet available.
A further caution applies to the Japan LNG comparison. Japan LNG is the relevant export opportunity cost for WA gas producers, but the price path of Japan LNG — spiking sharply after the Fukushima nuclear disaster in 2011, then declining as global LNG supply expanded — was driven by factors specific to Japan’s nuclear position and the global LNG investment cycle. WA’s domestic gas market did not experience that spike, consistent with the reservation policy providing insulation. But Japan LNG also fell substantially from its 2013–2014 peak as global LNG supply expanded. A comparison that indexes to Japan LNG’s tightest period overstates the counterfactual cost of operating without the reservation policy, because that period reflected exceptional conditions that did not persist.
Comparing Perth to the NEM: A Divergence and a Partial Convergence
The electricity CPI comparison between Perth and the NEM capital cities (Figure F-01) tells a story of reversal. In the early years of the available series (1989 to approximately 2003), Perth electricity CPI sat above most NEM cities — reflecting WA’s historically coal-dependent generation mix, its isolated grid with limited economies of scale, and the absence of the competitive pressures that the NEM’s interconnected market was beginning to exert on east coast generators.

Source: ABS 6401.0 Table 9 (previous series), quarterly, Original. Index reference: pre-2019 base.
From approximately 2007 to 2021, the positions reversed sharply. NEM cities experienced dramatic electricity price increases driven by network capital expenditure (”poles and wires” investment in NSW and Queensland), carbon price effects (2012–2014), and — for industrial consumers — the tightening of east coast gas supply as LNG export terminals reached capacity. Perth electricity CPI, meanwhile, grew comparatively modestly, reflecting the government’s sustained policy of below-cost tariff setting and WA’s insulation from east coast gas market dynamics.

The post-2022 period introduces renewed complexity. The Commonwealth’s Energy Bill Relief Fund suppressed measured electricity CPI in all jurisdictions, making direct comparison difficult. Perth’s measured electricity CPI in the most recent data reflects both the continued application of below-cost regulated tariffs and the effect of federal rebates. What the CPI series cannot fully capture is the growing divergence between the price consumers pay and the cost of supply — a gap that, in WA, is now explicitly funded through a dedicated $355 million budget line rather than simply absorbed into Synergy’s financial position.
Summary: Managed Insulation and Its Costs
Taken together, the consumer retail story of the WEM is one of managed insulation. Residential consumers have been substantially protected from wholesale price volatility by regulated tariffs set below cost. Gas consumers have been substantially protected from international price exposure by the combined effect of the reservation policy, coal competition, and renewable entry. Regional consumers have been protected from geographic cost differentials by the uniform tariff. These protections have carried real fiscal costs, borne by the State Budget and — through the Tariff Equalisation Contribution — by the commercial sector.
They have also carried structural costs that are less visible. A volumetric tariff with no demand component — the architecture that prevailed through the solar boom years — sent the right signal to reduce annual consumption, but the wrong signal about peak demand. The result was a system in which private bill savings and system cost increases occurred simultaneously, cost was transferred from solar adopters to non-adopters without being eliminated, and the network’s peak capacity obligation remained effectively unaddressed by the price signals households actually faced.
The question of whether these protections are sustainable in their current form, as the energy transition drives further cost pressure into the system, is the central pricing challenge that Part 8 addresses.
Key terms defined in this article:
Market Structure and Institutions
Economic Regulation Authority (ERA): The independent statutory body responsible for regulating network tariffs in Western Australia. The ERA sets the prices that Western Power and Horizon Power may charge for use of their transmission and distribution networks, determines benchmark efficient costs for electricity supply, and publishes formal inquiries into the costs and tariffs of state-owned utilities. The ERA’s role is distinct from the State Government’s role: the ERA sets cost benchmarks, but the Government makes final tariff decisions.
Horizon Power: The state-owned electricity utility that generates, distributes, and retails electricity to consumers in regional and remote Western Australia outside the SWIS. Horizon Power manages 38 separate electricity systems, ranging from the large North West Interconnected System (NWIS), which serves the Pilbara region, to small diesel-powered systems that serve remote communities. Its costs are substantially higher per unit of electricity than those on the SWIS, reflecting the absence of economies of scale, greater infrastructure distances, and, in some areas, reliance on diesel fuel.
National Electricity Market (NEM): The interconnected wholesale electricity market covering Queensland, New South Wales, the Australian Capital Territory, Victoria, South Australia, and Tasmania. The NEM operates as a single dispatch pool managed by AEMO, with prices set by the marginal generator in each five-minute dispatch interval. Western Australia is not part of the NEM; the SWIS operates under the separate Wholesale Electricity Market (WEM) with its own rules, price caps, and market structure.
Synergy: The state-owned electricity retailer and generator serving the SWIS, trading as the Electricity Generation and Retail Corporation under the Electricity Corporations Act 2005. Synergy is the exclusive retailer for non-contestable customers (those consuming less than 50 MWh per year) and the largest single participant in the SWIS wholesale market, operating approximately 2,235 MW of generation capacity. As of 2022-23, Synergy served approximately 1.05 million regulated electricity accounts. Synergy also administers government subsidies and concession payments to eligible customers on behalf of the State Government.
South West Interconnected System (SWIS) The main electricity network serving Perth and the south-west of Western Australia, extending from Kalbarri in the north to Albany in the south and Kalgoorlie in the east. The SWIS is an isolated grid — it has no physical connection to the eastern Australian electricity network or any other external grid. All electricity consumed in the SWIS must be generated within it. As of January 2025, the SWIS recorded an all-time peak demand of 4,486 MW.
Wholesale Electricity Market (WEM): The market framework under which electricity is bought and sold on the SWIS. The WEM has three principal components: bilateral contracts (privately negotiated agreements between generators and retailers); the Real-Time Market (formerly the Balancing Market), in which AEMO dispatches generators to meet demand in real time; and the Reserve Capacity Mechanism (RCM), which procures firm capacity to ensure sufficient generation is available to meet peak demand two years in advance.
Retail Market Terms
A1 Tariff (Home Plan): The standard regulated retail electricity tariff for residential customers of Synergy in the SWIS. The A1 tariff consists of a fixed daily supply charge (cents per day) and a variable usage charge (cents per kilowatt-hour). Both components are set annually by the WA State Government, not by the ERA. As of 2024-25, the A1 unit rate was approximately 31.58 cents per kWh, with a daily supply charge of 113.22 cents.
Community Service Obligation (CSO): Defined in section 99(1) of the Electricity Corporations Act 2005 as obligations imposed on a Government Trading Enterprise to perform functions or meet performance targets that are not in its commercial interests. In the electricity context, CSOs include Synergy’s obligation to supply electricity to all regulated customers at government-set tariffs below the efficient cost of supply, and to administer social concession and rebate payments on behalf of the State Government. The State Government compensates Synergy for these obligations through direct subsidy payments, described in Synergy’s Statement of Corporate Intent as “financial viability project subsidies.”
Contestable Customer: An electricity customer consuming more than 50 MWh per year who is eligible to purchase electricity on market-based terms rather than at the regulated tariff. Contestable customers can negotiate bilateral contracts directly with generators or retailers. Large industrial consumers — mining operations, refineries, and major commercial facilities — are almost entirely contestable. The 50 MWh contestability threshold has been in place since January 2005 and has not been lowered to full retail contestability as was contemplated in earlier market reviews.
Cost Recovery: The proportion of the actual efficient cost of electricity supply that is recovered through the tariff charged to consumers. A cost recovery rate below 100% means the State Government is subsidising the remainder through direct budget transfers or equity injections to Synergy. The ERA estimated in 2013 that residential customers were paying approximately 30% below the efficient cost of supply. By 2026-27, the State Government’s own documentation indicates cost recovery on the A1 residential tariff has declined from approximately 78 cents in the dollar to approximately 75 cents.
Non-Contestable Customer: An electricity customer consuming less than 50 MWh per year who is served exclusively by Synergy at the government-regulated tariff. Non-contestable customers have no choice of retailer and no ability to negotiate their electricity price. As of 2022-23, Synergy served approximately 1.05 million non-contestable electricity accounts in the SWIS.
Regulated Tariff: An electricity price set by the WA State Government (rather than by the market) that applies to non-contestable residential and small business customers. The regulated tariff is reviewed and adjusted annually. It is currently set below the ERA’s benchmark of efficient cost, meaning the government subsidises the gap between the tariff and the true cost of supply.
Tariff Restructuring (2018/19): A significant change to the structure of the A1 residential tariff implemented from 1 July 2018, which more than doubled the fixed daily supply charge — from 48.60 cents per day to 101.55 cents per day — while holding the unit rate increase to approximately 7%. The restructuring shifted cost recovery from the variable usage component toward the fixed component, more accurately reflecting the largely fixed nature of network infrastructure costs. The change was advocated by the ERA on cost-reflectivity grounds but had regressive distributional effects on low-consumption households, who cannot reduce their fixed supply charge through conservation.
Uniform Tariff Policy: The Western Australian Government’s long-standing commitment to charge electricity consumers in regional and remote areas served by Horizon Power the same retail tariff as metropolitan SWIS consumers, regardless of the higher actual cost of supplying electricity in those areas. The policy is funded through the Tariff Equalisation Contribution paid by commercial SWIS customers and direct government appropriations to Horizon Power.
Subsidy and Concession Mechanisms
Cost Growth Assistance Payment: A dedicated budget appropriation introduced by the WA State Government to fund the gap between Synergy’s efficient cost of supply and the regulated tariff. Committed at $355 million over four years in the 2026-27 Budget, this payment replaced an earlier approach in which below-cost tariff support was managed through Synergy’s balance sheet and equity position. The explicit appropriation makes the subsidy visible in the Budget rather than embedded in Synergy’s financial position.
Dependent Child Rebate (DCR): A state government concession payment administered through Synergy billing for eligible households with dependent children. In 2022-23, the DCR reached approximately 75,795 recipient accounts at a total program cost of $23.3 million.
Distributed Energy Buy-back Scheme (DEBS): The current scheme under which residential and small business solar customers in the SWIS receive payment for electricity they export to the grid. DEBS replaced the earlier Renewable Energy Buy-back Scheme (REBS) and the Premium Net Feed-in Tariff (PNFIT). Unlike the flat-rate export payments of earlier schemes, DEBS uses time-of-day varying rates: approximately 10 cents per kWh for evening exports (when grid value is higher) and approximately 2 to 3 cents per kWh for daytime exports (when solar supply is abundant and grid value is low). As of 2022-23, approximately 146,000 customer accounts were enrolled in DEBS, with forecasts projecting growth to 292,000 accounts by 2025-26.
Energy Assistance Payment (EAP): The principal electricity concession payment for eligible low-income households in Western Australia, administered through Synergy billing. Eligibility is linked to holding a Centrelink Health Care Card, Pensioner Concession Card, or equivalent. In 2022-23, the EAP reached approximately 331,026 recipient accounts at a total cost of $77.6 million — representing approximately 32% of Synergy’s total regulated customer base.
Energy Bill Relief Fund: A Commonwealth Government program providing direct bill rebates to eligible residential electricity customers. From 2023-24, eligible WA households received $300 per year (paid in quarterly instalments) through the scheme, which continues into 2025-26. The fund applies to all Australian jurisdictions and is a temporary measure subject to annual budget renewal.
Financial Viability Project Subsidies: The category of direct government subsidies to Synergy that compensate for structural below-cost trading identified through the financial viability project. In 2022-23, these subsidies totalled $229.1 million and included the System Security Transition Payment, Renewable Energy Buyback Scheme payments, Distributed Energy Buyback Scheme shortfalls, Tariff Equalisation Contribution recovery, and WEM reform costs. The government formally treats these payments as community service obligations under the Electricity Corporations Act 2005.
Premium Net Feed-in Tariff (PNFIT): A government scheme that paid enrolled residential solar households 40 to 60 cents per kWh for electricity exported to the SWIS grid. The PNFIT was available from mid-2010 and closed to new applicants in August 2011. Export rates under the scheme far exceeded the wholesale value of the electricity, reflecting a deliberate government policy to accelerate early rooftop solar adoption by shortening payback periods. The government’s financial obligation to existing PNFIT enrollees continues until those contracts expire.
Renewable Energy Buy-back Scheme (REBS): The predecessor to DEBS, providing flat-rate export payments to solar households not enrolled in the Premium Net Feed-in Tariff. REBS is being phased out as enrolled households transition to DEBS. As of 2022-23, approximately 251,722 customer accounts remained on REBS, declining to a forecast of 202,475 by 2025-26 as customers roll off the scheme.
Small-scale Technology Certificates (STCs): Subsidies created under the Commonwealth’s Small-scale Renewable Energy Scheme that directly reduce the upfront capital cost of residential and small business solar systems at the point of installation. The STC value is calculated based on the system's projected generation over a deeming period, and installers typically pass the benefit on as an upfront discount to the purchaser. The STC scheme has been a major driver of rooftop solar adoption across Australia, including in Western Australia.
System Security Transition Payment (SSTP): A direct government payment to Synergy introduced to compensate for costs associated with managing system security during the transition to the new WEM, including the operational costs of maintaining thermal generation capacity needed for frequency stability and reliability while large volumes of variable renewable energy were integrated. Budgeted at $82.4 million in 2022-23, declining to nil by 2025-26.
Tariff Equalisation Contribution (TEC): A cross-subsidy levy applied to commercial customers in the SWIS network, the proceeds of which are transferred to Horizon Power to fund the gap between its actual cost of supply in regional and remote areas and the uniform tariff charged to those customers. In 2026-27, the TEC amounts to approximately $290 million. In 2022-23, Synergy recovered $91.9 million in TEC costs through its network charges, administered on behalf of approximately 1.03 million SWIS accounts.
Electricity Pricing Concepts
Demand Tariff: A network charge based on a customer’s maximum power draw (measured in kilowatts or kilovolt-amperes) during defined peak periods, rather than on total annual energy consumption. A demand tariff more accurately reflects the true cost of electricity networks, which must be sized to meet peak demand regardless of how much energy is consumed across the year. Grattan Institute analysis of Western Power customer data (2015) found that a demand tariff would substantially reduce cross-subsidies between households in the SWIS. WA’s residential tariff structure has not incorporated a demand component; the 2018/19 restructuring moved toward a higher fixed charge but stopped short of a demand-based design.
Economies of Scale: The reduction in average cost per unit as the volume of output increases. Electricity networks exhibit strong economies of scale: a denser network serving more customers over a given geographic area has a lower cost per customer than a sparse network serving fewer customers over the same area. This is the fundamental economic reason why supplying electricity to remote communities via Horizon Power is more expensive per unit than supplying dense metropolitan areas through the SWIS — and why the Uniform Tariff Policy requires cross-subsidisation.
Fixed Daily Supply Charge: The component of a residential electricity bill that is charged at a fixed daily rate regardless of how much electricity is consumed. The supply charge nominally reflects the cost of maintaining a household’s grid connection — metering, network availability, and retail service costs that are incurred whether or not the household draws any electricity. As of 2024-25, the A1 fixed daily supply charge was 113.22 cents per day, equivalent to approximately $413 per year.
System Minimum Demand: The lowest level of electricity demand on the SWIS at any point in time, typically occurring at midday on sunny days when rooftop solar generation is at its peak and industrial and commercial demand is moderate. As solar penetration has grown, system minimum demand has fallen to levels that challenge the operational requirements of coal-fired baseload generators, which cannot be shut down and restarted within the hours available between a solar midday minimum and an evening demand peak. Managing system minimum conditions — by keeping thermal plants online at part-load or curtailing solar output — imposes real operational costs that are not reflected in volumetric electricity tariffs.
Volumetric Tariff: An electricity tariff under which customers pay primarily or exclusively based on the total volume of electricity consumed (kilowatt-hours), with a modest fixed daily component. WA’s A1 residential tariff is predominantly volumetric: prior to the 2018/19 restructuring, approximately 90% of the average household bill was in the usage component. A volumetric tariff gives households an incentive to reduce total annual consumption, but provides no incentive to reduce demand specifically during the peak periods that drive network infrastructure costs.
Generation and Network Terms
Behind-the-Meter Generation: Electricity generation installed on a customer’s premises — typically rooftop solar panels — that supplies the customer’s own load before any surplus is exported to the grid. Behind-the-meter generation reduces a customer’s net grid consumption and therefore their variable electricity charges, but does not reduce the customer’s peak demand on the grid unless paired with battery storage capable of discharging during evening peak periods.
Bilateral Contract: A privately negotiated, legally binding agreement between an electricity generator and a retailer (or large industrial customer) specifying the volume, price, and delivery schedule of electricity over a defined period. Bilateral contracts are the primary mechanism through which large contestable customers in the SWIS purchased electricity during the WEM’s first decade, typically pricing off domestic gas market rates. These contracts are separate from the Real-Time Market and provide both parties with price certainty and volume commitment.
Collie Basin Coal: Thermal coal mined from deposits in the Collie region of south-west Western Australia, used to fuel the Muja and Collie power stations. Collie basin coal served as the primary fuel for SWIS baseload generation from the 1960s through to the 2020s. Because Collie coal was priced domestically rather than at export parity, it provided a competitive pricing anchor for gas-fired generation throughout the WEM’s first decade. The scheduled retirements of Muja D (2029) and Collie Power Station (2027) will complete WA’s exit from coal-fired generation.
Distributed Energy Resources (DER): Small-scale energy technologies installed at or near the point of consumption, including rooftop solar panels, residential and commercial battery storage systems, electric vehicles, and demand response capabilities. DER is transforming the SWIS by reducing grid demand during daylight hours, increasing volatility at system transitions (particularly the morning and evening ramp periods), and creating new operational challenges for system frequency management.
Domestic Gas Reservation Policy: A Western Australian Government policy, announced in September 2006 and legally operative from 2011, requiring each new LNG export project to reserve 15% of its gas production for the domestic market. The policy guarantees a minimum volume of gas for domestic buyers but does not set the price at which that gas must be sold. Its effect on domestic gas prices operates through supply availability: by ensuring a minimum domestic supply obligation, it prevents the complete withdrawal of domestic supply into export markets that occurred on the East Coast after 2014.
Gas-Powered Generation (GPG): Electricity generation using natural gas as fuel, encompassing open-cycle gas turbines (OCGTs, used for peaking), combined-cycle gas turbines (CCGTs, used for baseload and mid-merit), and reciprocating gas engines. On the SWIS, GPG has become increasingly important as coal-fired generation retires and as the need for flexible, dispatchable capacity grows to firm variable renewable energy. The AEMO 2025 WA Gas Statement of Opportunities projects that SWIS GPG demand will become increasingly volatile as renewable penetration grows, driving higher and more variable gas consumption during periods of low solar and wind output.
LNG Export Parity: The price at which domestic gas buyers would need to compete with international LNG importers if all domestic gas were redirected to export markets. Following the commissioning of Queensland LNG export terminals from 2014 to 2016, eastern Australian domestic gas prices converged toward LNG export parity, substantially increasing gas costs for east coast manufacturers, power generators, and residential consumers. WA’s domestic gas market was partially insulated from this dynamic by the reservation policy and by continued competition from coal-fired generation.
North West Shelf (NWS): One of Australia’s largest LNG export projects, located offshore north-west Western Australia. The NWS partners signed take-or-pay domestic gas supply contracts with the State Energy Commission of Western Australia (SECWA) in 1980, which provided the foundation for WA’s gas-based electricity generation system. The original NWS–SECWA contracts used coal-competitive pricing formulas that held upstream gas prices at approximately AUD $2–3 per gigajoule through the contract period to 2005, establishing a domestic gas price benchmark far below international LNG prices.
Reserve Capacity Mechanism (RCM): The component of the WEM that procures firm, dispatchable electricity generation capacity to meet the SWIS’s reliability standard, defined as the capacity needed to serve peak demand. Generators and other capacity providers are certified for capacity credits and receive an annual payment — the Reserve Capacity Price — in exchange for their obligation to be available during peak demand periods. The RCM procures capacity approximately two years in advance and serves as the mechanism by which the fixed costs of maintaining a reliable generation fleet are recovered from market participants.
Reserve Capacity Price (RCP): The annual per-megawatt payment received by generators holding capacity credits under the WEM’s Reserve Capacity Mechanism. The RCP is derived from the Benchmark Reserve Capacity Price (BRCP), which the ERA sets annually based on the estimated annualised capital and fixed operating cost of a theoretical new-entrant generator. The RCP for the 2027-28 capacity year is $360,700 per MW. This price is passed on to electricity consumers through retailers’ capacity cost obligations.
Security-Constrained Economic Dispatch (SCED): The real-time dispatch methodology introduced to the WEM in October 2023 as part of the new market design. Under SCED, AEMO dispatches generators to minimise the total cost of meeting demand, subject to network security constraints, replacing the previous Balancing Market in which generators self-scheduled based on their own cost estimates. SCED is expected to improve dispatch efficiency and reduce wholesale energy costs over time, but its introduction was associated with elevated energy prices in its first year of operation.
Western Power: The state-owned electricity network business responsible for the transmission and distribution infrastructure serving the SWIS. Western Power owns and operates the poles, wires, substations, and associated infrastructure through which electricity is physically transported from generators to consumers. Western Power’s network charges are regulated by the ERA and recovered through retail tariffs. Western Power is the entity through which the Tariff Equalisation Contribution is collected and passed to Horizon Power.
Source Information
Australian Bureau of Statistics (2026). Consumer Price Index, Australia. Cat. 6401.0, Tables 9, 10 and 18.
“TABLE 10. CPI: Group, Sub-Group and Expenditure Class, Index Numbers by Capital City.” Australian Bureau of Statistics, March 2026. https://www.abs.gov.au/statistics/economy/price-indexes-and-inflation/consumer-price-index-australia/mar-2026/6401010.xlsx.
Inquiry into the Efficiency of Synergy’s Cost and Electricity Tariffs. Analytical Report. Economic Regulation Authority, Western Australia, 2012. https://assets.pc.gov.au/inquiries/completed/electricity/submissions/subdr078-electricity.pdf.
State Government of Western Australia. “2026-27 Budget Papers | Western Australia State Budget.” May 7, 2026. https://www.ourstatebudget.wa.gov.au/budget-papers.html.
Wood, Tony, and David Blowers. Fair Pricing for Western Australia’s Electricity. Policy Analysis. Grattan Institute, 2015. https://grattan.edu.au/wp-content/uploads/2015/11/831-Fair-pricing-for-Western-Australia-electricity.pdf.